Jan Dokoupil

Aspiring Data Analyst with hands-on experience in customer service, investment operations, and warehouse management. Proficient in Power BI, Excel, and Python, with growing expertise in SQL. Skilled in using data to drive informed decisions and eager to contribute to dynamic, data-driven teams.
Data Analyst
Technical Skills: Power BI, Python, SQL, MS Excel
Multi-Tool Projects
Brazilian E-Commerce Analysis: Insights into Marketplace Trends with Python and Power BI
This project combines the analytical capabilities of Python and Power BI to explore around 100,000 orders from the Brazilian e-commerce marketplace Olist. By leveraging Python for data preprocessing and Power BI for visualization, the project provides a comprehensive view of marketplace performance, including customer behavior, delivery performance, and sales trends.
Key Features:
- Python: Data cleaning, validation, and preprocessing tasks (e.g., handling missing data, feature engineering).
- Power BI: Interactive dashboards for sales metrics, customer insights, and delivery performance.

Python Projects
Sales Analysis: Evaluating Sales Strategies for Optimal Revenue
This project involves analyzing the effectiveness of different sales approaches (Email, Call, and Email + Call) using Python to optimize the company’s strategy. By evaluating the number of customers, revenue distribution, and overall performance for each method, the project provides data-driven recommendations on the most effective sales approach to maximize revenue while minimizing time and resource investment.
Tools & Libraries: Pandas, NumPy, Matplotlib, Seaborn Key Insights:
Email + Callmethod generated the highest average revenue per customer, despite requiring only 10 minutes per call.Emailmethod had the broadest reach, making it the most efficient for mass outreach with minimal effort.Callmethod, although time-consuming, proved to be the least effective, generating the lowest revenue per unit sold.
This project showcases data cleaning, exploratory data analysis (EDA), and visualization techniques, providing actionable insights based on customer sales data.
Power BI Projects
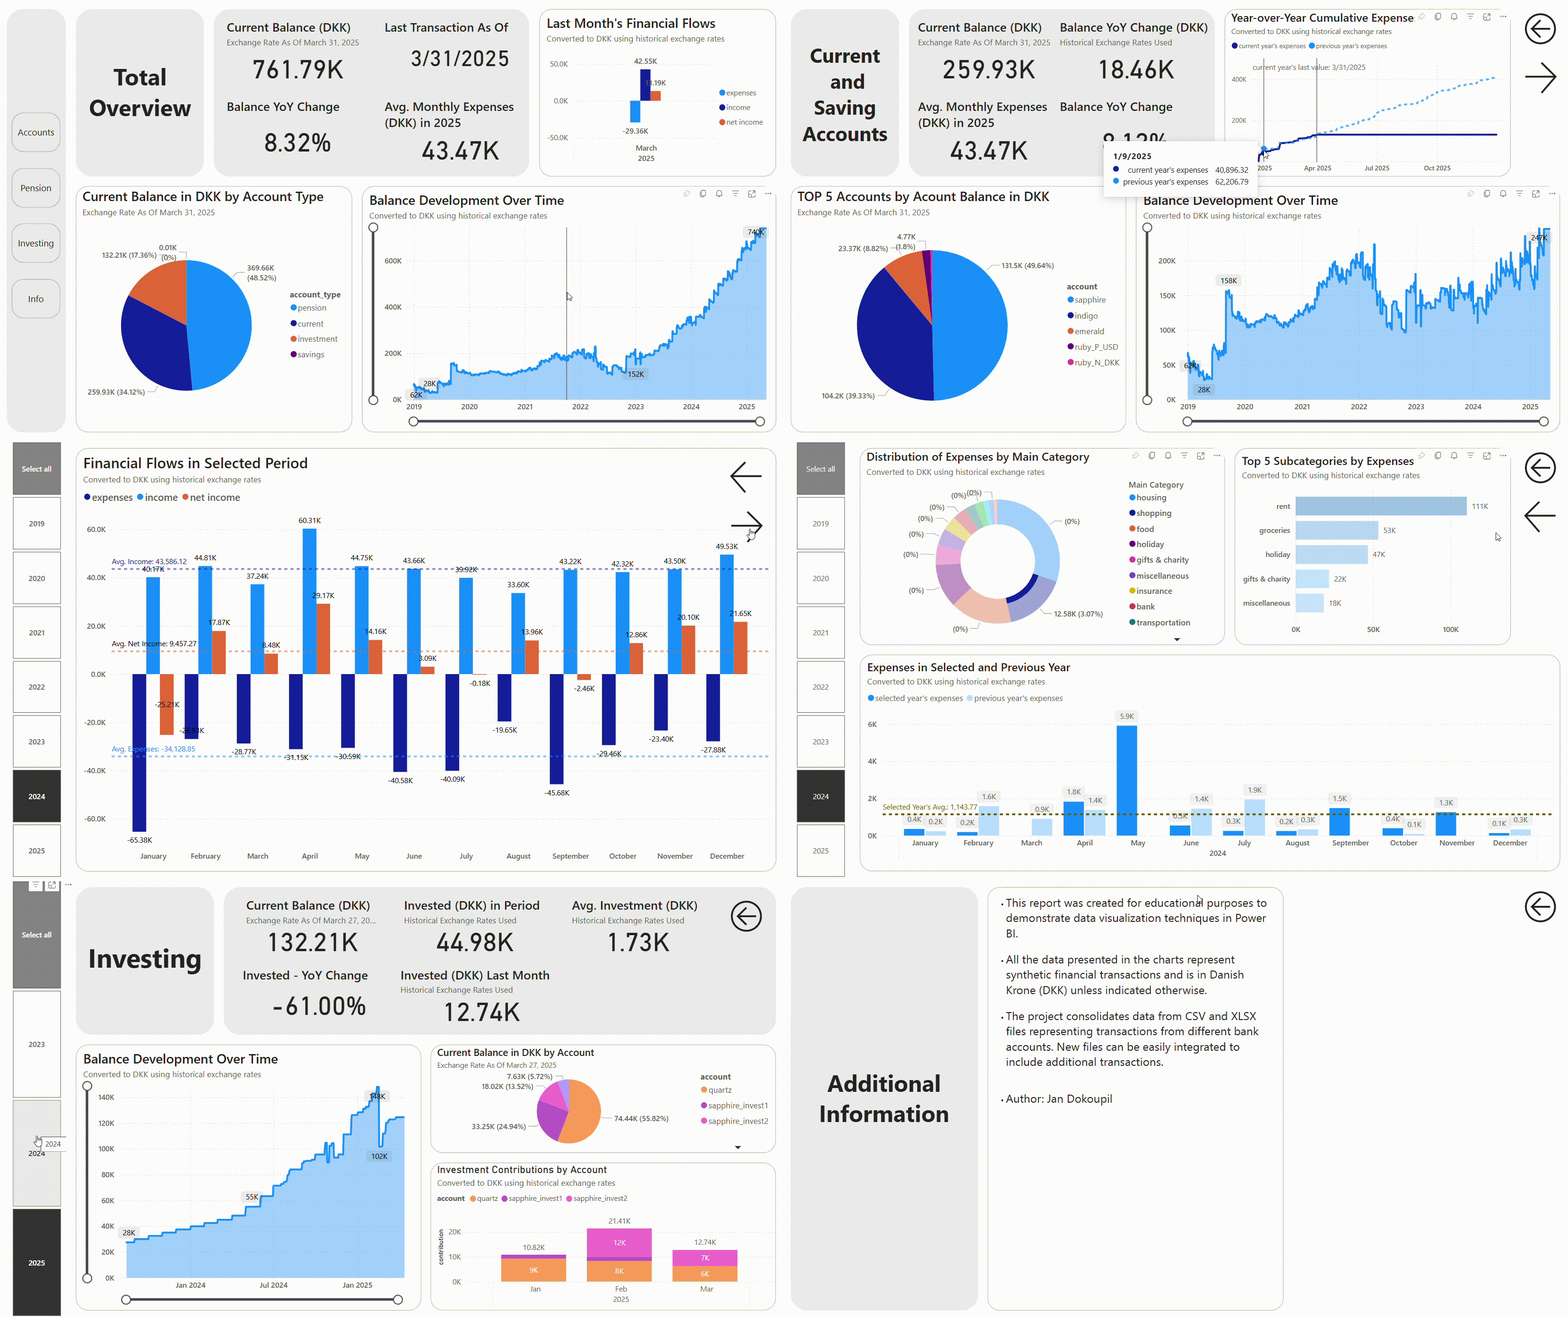
Personal Finance Analysis
This project facilitates in-depth analysis of family expenses by consolidating data from diverse sources, including CSV files from various bank accounts. Demonstrating advanced data visualization techniques within Power BI for educational purposes, the report showcases synthetic financial transactions. While the dataset contains multiple currencies, all values are uniformly presented in Danish Krone (DKK) in the visualizations unless explicitly stated otherwise. Offering insights into account balances, income, expenses, and investment trends over time, users gain comprehensive insights into their financial dynamics. The project consolidates data from CSV files representing transactions, ensuring seamless integration for ongoing analysis and optimization.

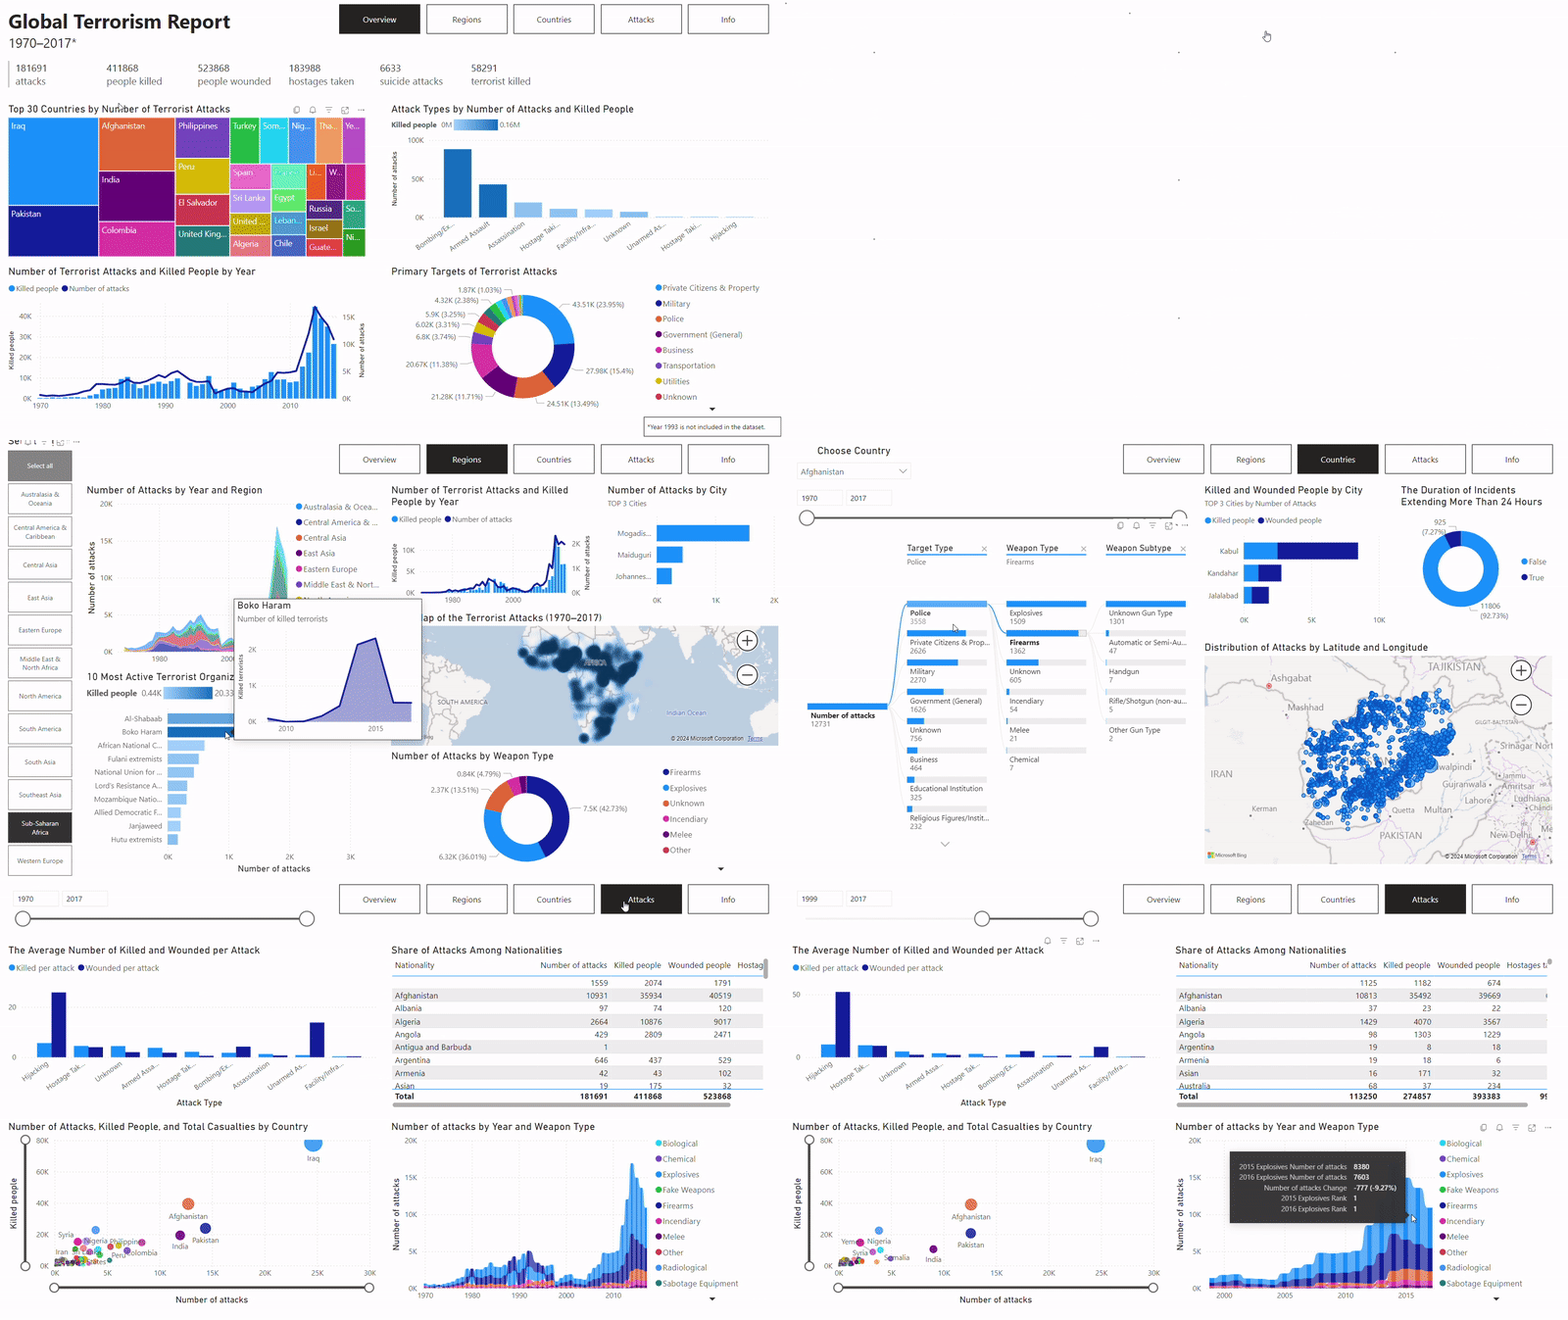
Global Terrorism Analysis: Exploring Terrorist Incidents from 1970 to 2017
Global Terrorism Analysis is a project aimed at unraveling the complexities of global terrorism using interactive visualizations and data insights. Leveraging the extensive Global Terrorism Database (GTD), comprising over 180,000 recorded incidents, this project provides a comprehensive overview of terrorist activities worldwide. Through insightful analysis of attack types, geographical distributions, and temporal trends, stakeholders gain valuable insights into the multifaceted nature of terrorisms.

SQL Projects
As part of my SQL learning journey on DataCamp, I completed several projects involving data analysis. Here’s a brief summary of two key projects:
Impact Analysis of GoodThought NGO Initiatives
- Listed the top five assignments by total donation value, categorized by donor type.
- Identified the highest impact score assignment per region, with at least one donation.
Evaluating of a Manufacturing Process
- Analyzed the manufacturing_parts table to determine if the process was within acceptable control limits using SQL window functions and nested queries.
- Created an alert system that flagged products with heights outside control limits for each operator.
Analyzing Unicorn Companies
- Identified the three best-performing industries based on new unicorns created in 2019, 2020, and 2021 combined, and created a table with industry, year, number of unicorns, and average valuation in billions, sorted by year and number of unicorns.
Education
- Master’s degree, International Territorial Studies, Mendel University in Brno (2015 – 2021)
- Study stay in South Korea, Kangwon National University (2018, 1 semester)
- Study stay in Estonia, Tallinn University of Technology (2016, 1 semester)
Work Experience
Warehouse worker @ Salling Group (Jun 2022 – Present)
- Return Processing: Handle the return of items from shops to suppliers
- Goods Receiving: Manage incoming goods and coordinate with drivers for efficient delivery
Investment Operations Officer @ FNZ Group (Apr 2021 - Feb 2022)
- Portfolio Management: Responsible for overseeing transactions with precision and compliance
- Client Communication: Facilitate effective communication with clients and fund administrators to ensure seamless operations
Customer Representative @ Zebra Technologies (Jun 2019 - Dec 2020)
- Customer Support: Provide assistance to customers from UK
- Request Management: Efficiently manage and process requests for repairing of purchased devices
- Data Analysis: Utilize Excel to analyze the duration items were on hold for efficient resolution
Volunteering
Volunteer Teacher @ ReDI School of Digital Integration Aarhus (Mar 2025 – Present)
- Teaching in the “Computer for Work – Beginners” course, helping women with migrant backgrounds develop digital skills.
- Providing practical guidance in the use of digital tools such as Gmail, Google Docs, and online collaboration platforms.
Licenses & certifications
- Excel VBA Programmering grundlæggende, 4D Academy ApS (March 2025)
- Microsoft Excel - Advanced, International Business College (January 2025)
- Data Analyst, DataCamp (September 2024)
- Data Analyst Associate, DataCamp (July 2024)
- Prøve i Dansk 3, CLAVIS sprog & kompetence (June 2024)
- Microsoft Excel - Intermediate, International Business College (April 2024)
- English - EF Level 14 - Advanced - CEFR Level C1, EF Education First (February 2024)
- Analyze and Visualize Data with Power BI, PeopleNET A/S (January 2024)
- Python Programming - 4 days, NobleProg (August 2023)